Columbine Valley Real Estate Market 2025: Price Per Square Foot Trends & Neighborhood Breakdown
Ah, Columbine Valley—our charming corner of Denver where golf carts outnumber traffic jams, and homes whisper stories of timeless appeal. As we kick off 2026, it's the perfect moment to look back at the 2025 Columbine Valley real estate market and see how price per square foot finished (PSF) trended compared to 2024. This metric cuts through home-size noise to reveal true value shifts across neighborhoods. We've pulled every closed sale, sorted by pocket, and added visuals so you can spot patterns quickly. (Spoiler: Some areas held steady like a well-read putt, while others surged ahead.)
Behind every number, though, there's an intangible story—the family upgrading for more space, the buyer captivated by sunrise views, the seller who timed it just right—that stats alone can't capture. That's why we always encourage a conversation with us to unpack why each home sold and how it relates to your situation.
Curious how your home or target block performed? Reach out to Ben and Erin Rule at RuleProperties.com. We live here, track every sale, and love turning local data into real-world strategy.
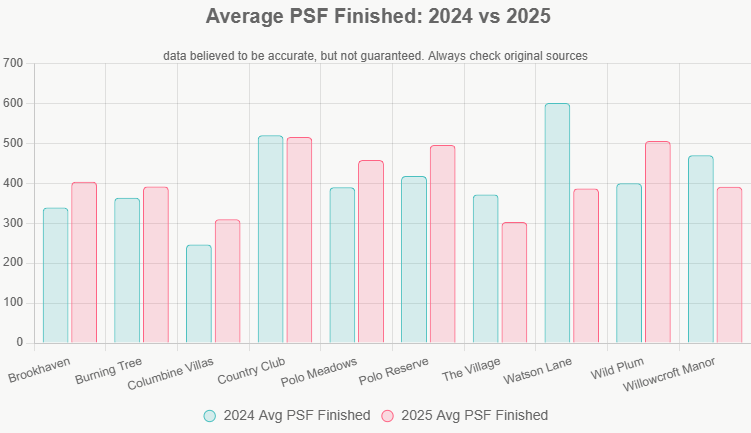
Columbine Valley Price Per Square Foot by Neighborhood: 2024 vs 2025
One row per neighborhood for easy scanning. These figures highlight trends, but remember: each sale has its own backstory of condition, updates, and buyer motivation that influenced the final price.
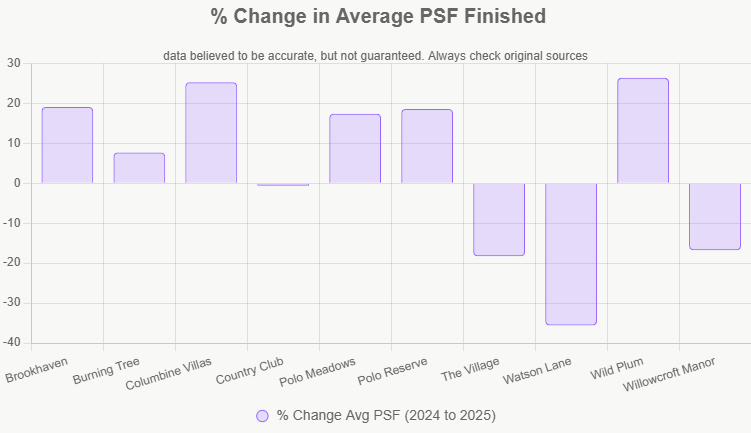
| Neighborhood | Avg PSF Finished 2024 | Median PSF Finished 2024 | Range 2024 | Avg PSF Finished 2025 | Median PSF Finished 2025 | Range 2025 | % Change Avg PSF |
|---|---|---|---|---|---|---|---|
| Brookhaven | $339 | $342 | $270–$386 | $404 | $404 | $386–$422 | +19.1% |
| Burning Tree | $364 | $363 | $327–$405 | $392 | $403 | $272–$458 | +7.7% |
| Columbine Villas | $247 | $247 | $242–$253 | $310 | $301 | $263–$371 | +25.3% |
| Country Club | $520 | $494 | $425–$635 | $516 | $517 | $354–$683 | -0.6% |
| Polo Meadows | $390 | $390 | $371–$410 | $458 | $458 | $377–$540 | +17.4%* |
| Polo Reserve | $418 | $418 | $318–$518 | $496 | $496 | $410–$582 | +18.6% |
| The Village | $372 | $372 | $210–$533 | $303 | $303 | $272–$335 | -18.3% |
| Watson Lane | $601 | $601 | $597–$605 | $387 | $387 | $387–$387 | -35.6% |
| Wild Plum | $400 | $400 | $400–$400 | $506 | $465 | $423–$717 | +26.4% |
| Willowcroft Manor | $470 | $470 | $470–$470 | $391 | $364 | $361–$448 | -16.8% |
*Polo Meadows note: 2025 includes one large Cottonwood Place sale at higher PSF. Excluding it: ~$377 avg → -3.4% change. Small-sample effect in action!
Visual Snapshot: PSF Finished Movement 2024–2025
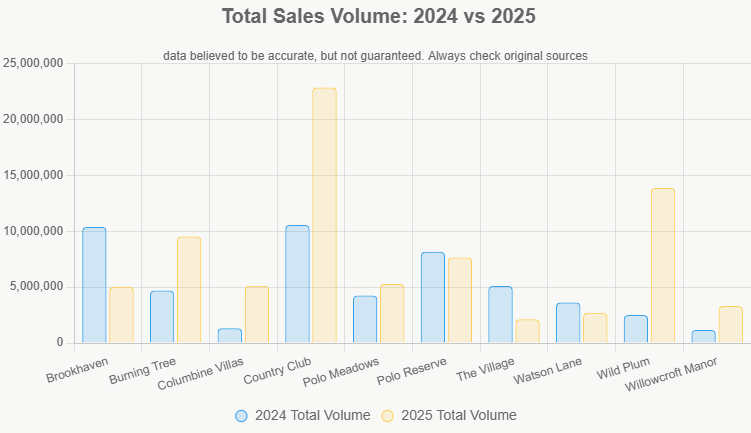
Sales Activity & Average Sale Prices: 2024 vs 2025
Volume tells part of the story—higher activity often means stronger buyer interest—but each close has its own narrative worth exploring.
| Neighborhood | Sales 2024 | Total Volume 2024 | Avg Sale Price 2024 | Sales 2025 | Total Volume 2025 | Avg Sale Price 2025 |
|---|---|---|---|---|---|---|
| Brookhaven | 6 | $10.38M | $1.73M | 2 | $5.03M | $2.52M |
| Burning Tree | 4 | $4.69M | $1.17M | 6 | $9.53M | $1.59M |
| Columbine Villas | 2 | $1.33M | $667K | 6 | $5.13M | $854K |
| Country Club | 5 | $10.56M | $2.11M | 11 | $22.84M | $2.08M |
| Polo Meadows | 2 | $4.24M | $2.12M | 2 | $5.28M | $2.64M |
| Polo Reserve | 2 | $8.16M | $4.08M | 2 | $7.66M | $3.83M |
| The Village | 4 | $5.11M | $1.28M | 2 | $2.13M | $1.06M |
| Watson Lane | 2 | $3.63M | $1.82M | 1 | $2.70M | $2.70M |
| Wild Plum | 1 | $2.50M | $2.50M | 5 | $13.87M | $2.77M |
| Willowcroft Manor | 1 | $1.17M | $1.17M | 3 | $3.30M | $1.10M |
Average Days on Market & Close-to-List Ratio: 2024 vs 2025
Shorter DOM and higher close ratios usually signal strong demand, but longer times or bigger discounts often tie back to unique circumstances—stories we’d love to walk through with you.
| Neighborhood | Avg DOM 2024 | Avg % Close/List 2024 | Avg DOM 2025 | Avg % Close/List 2025 |
|---|---|---|---|---|
| Brookhaven | 57 | 94% | 39 | 97% |
| Burning Tree | 20 | 93% | 45 | 93% |
| Columbine Villas | 69 | 93% | 26 | 96% |
| Country Club | 42 | 91% | 67 | 89% |
| Polo Meadows | 3 | 98% | 74 | 93% |
| Polo Reserve | 106 | 93% | 8 | 99% |
| The Village | 23 | 95% | 4 | 90% |
| Watson Lane | 85 | 100% | 100 | 92% |
| Wild Plum | 2 | 100% | 21 | 98% |
| Willowcroft Manor | 247 | 78% | 0 | 98% |
Visual Snapshot: Sales Volume Momentum 2024–2025
What These Columbine Valley Market Trends Tell Us Locals
- Wild Plum stole the show—+26.4% PSF and volume jump from 1 to 5. Buyers clearly rewarded newer builds and turnkey appeal, but each sale had its own spark—let’s talk about what drove them.
- Country Club stayed rock-steady on PSF while volume doubled. Classic luxury endures here, often sealed by heritage charm, views, or community ties that numbers can’t fully show.
- Columbine Villas & Brookhaven posted strong gains—proof that well-prepped homes in solid pockets can outperform. Behind the stats are families finding their forever fit.
- Low-volume areas (Watson Lane, Willowcroft) show bigger swings—normal in our boutique market. One exceptional property can move the needle; we can help you understand the full context.
Bottom line for the 2025 Columbine Valley real estate market: quality, location, and smart preparation still win. If you're thinking about selling or buying in 2026, the data is encouraging—especially for move-in-ready homes priced right.
Ready to see where your property fits in this picture? Reach out to Ben and Erin Rule at RuleProperties.com. We’re locals with deep market knowledge and zero-pressure advice—just good conversation and honest insights.
Questions about these Columbine Valley home price trends? We’re here—drop us a line anytime.